Articles
New ways to analyze network traffic with Suricata
Network traffic analysis is the process of looking at the data traversing a network to find problems. It is traditionally done for a number of purposes, including basic troubleshooting of network performance/connectivity, application performance, and as part of a robust cybersecurity framework.
At QA Cafe, we’ve made an effort to make network traffic analysis easier using CloudShark. Through our work, we’ve also discovered new ways to use network security analysis tools as part of network and IoT product testing within CDRouter and PassPort respectively. These methods help developers build more robust products, and help network professionals who are deploying those products (e.g. in broadband or enterprise networks) to understand how they work, ensure that they perform well, and guarantee that they adhere to security and operational policies.
There are a plethora of tools in the industry that help with traffic analysis. In particular are those tools that allow for threat detection, looking for warning signs of malicious activity within network traffic. The open-source threat detection engine known as Suricata is one of those tools. In this article, we explore what Suricata is, what it does, and some of the new and interesting ways we use Suricata in CloudShark, CDRouter, and PassPort.
What is Suricata?
Suricata is the leading independent open-source threat detection engine. It combines aspects of an intrusion detection system (IDS), intrusion protection system (IPS), network monitoring system (NMS), and the ability to operate on packet captures to help cybersecurity analysts identify, investigate, and protect against malicious attacks. Owned by the Open Information Security Foundation (OISF), it has a dedicated and responsive community that manages the project and keeps it up to date.
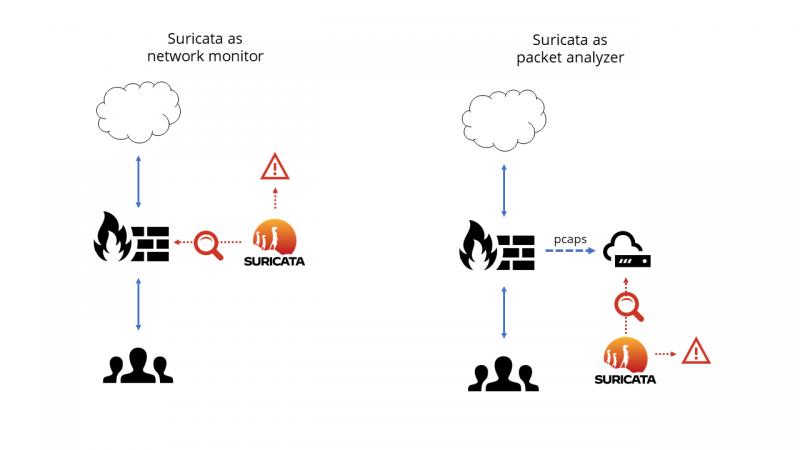
Suricata works by operating either on live traffic, or on recordings of network traffic stored in a packet capture. That is, it can operate either in real-time as a network monitor, or after-the-fact as a forensic tool. In real-time, Suricata will often work alongside a firewall, router, or other node where traffic is processed before being sent to the next network location. In the latter, Suricata can work as part of a larger system that gathers and operates on packet captures.

What is a rule and a rule set?
Suricata does its job by taking a collection of rules (known as “rule sets”) and applying those rules to the contents of the packets travelling across the network. Suricata rules are “signature based”, which means that they are written to look for a particular pattern, or signature, within the network traffic, and then produce certain alerts (sometimes with additional reference information) if those patterns are discovered.
The cybersecurity industry has developed many Suricata rules and rule sets over time. Open-source rule sets exist (like the ET Open rule set) and are maintained by the community. Additionally, however, Suricata rules can be customized to flag traffic that is of interest to a particular organization based on their experience with previous security intrusions.
This custom rule capability can go beyond just security uses, however. Suricata rules can be written to flag internal network policy violations, regressive behavior of applications, or anything that can be identified by monitoring network packet data. This makes Suricata a useful tool for a number of use cases that go beyond intrusion detection and prevention.
Visualizing Threat Vectors
We first took a look at using Suricata when we were developing CloudShark’s Threat Assessment tool. Our goal with CloudShark is to make network and security analysis easier, especially for teams, when working with packet captures. Since Suricata can operate on pcaps of network traffic, we can take the data it provides, present it in an easy to consume format, and use CloudShark to let analysts pivot between alerts and the captures that cause them.
Integral to this design is CloudShark’s “Threat Vectors”, which show the flow of traffic that has triggered Suricata alerts.
By clicking on one of the vectors, you can see which rule was triggered, read any reference material that discusses the alert, and immediately apply a filter to the capture to view the offending packets. Using the resulting URLs, an analyst can share their investigation directly without repeating steps.
Monitoring network products during testing
Suricata can apply its rules and produce alerts in real time as a network monitor. As we mentioned above, this is usually used in a real network at a point of demarcation like a router or firewall. But what if we use it when testing network products for feature validation, performance, and security?
QA Cafe’s flagship product, CDRouter, is built to test products like broadband CPE, Wi-Fi routers, and other SOHO and enterprise networking devices. This is done by isolating the device under test (DUT) in a simulated network environment and sending specific traffic to or through the DUT to ensure that it works correctly and remains stable over time. We consider sending this specific traffic to stimulate the DUT to be a kind of “active” testing.
However, in recent years, these devices have become more dependent on cloud services to operate. In addition, they have also become a common target for hackers. We wanted to take what we have learned from working with Suricata and see if we could apply rules to the traffic that the DUT was sending out, either because of traffic that prompted it, or simply as part of its normal operation. This we considered a more “passive” kind of testing, observing a DUT’s behavior during testing.
We launched this ability in our CDRouter Security expansion. The expansion does three main things:
- It allows devices under test to connect to the Internet in addition to the connections made in our simulated network.
- It separates traffic that is destined for CDRouter’s simulated network endpoints from traffic that would be sent to other network destinations.
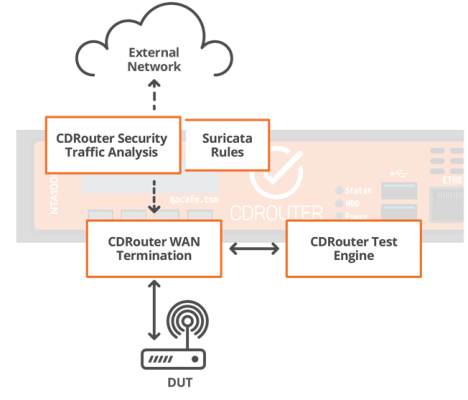
- It allows Suricata to monitor the non-test network traffic and provides an interface for viewing alerts that arise during testing.

This traffic bound for the Internet is monitored, captured, and analyzed by CDRouter using Suricata.
Dynamic and Custom Rule Creation
CDRouter Security includes the ET Open ruleset, as well as rules developed by QA Cafe for use with CDRouter. These rules are tailored to the security or behavior issues that are most commonly encountered in broadband or Wi-Fi gateways.
The real power behind our QA Cafe curated rules in CDRouter is that they are created dynamically. CDRouter will create Suricata rules that include test and network configuration details automatically at the start of testing. For example, information like the MAC address of simulated hosts, Wi-Fi passwords, etc., are incorporated into these rules to check that the DUT is not sending this information to its cloud services unencrypted.
Additionally, CDRouter’s use of Suricata includes the ability for users to add their own custom rules. This can be used to verify that certain policy or functional changes to the DUT have actually taken effect - for example, a broadband provider that changes the fixed URL of a cloud service to a new one can make sure that their gateways don’t try to connect to the old service.
Applying rules to IoT products
QA Cafe launched the PassPort test solution in 2021. It is designed to test connected devices like IoT and smart home products, set top boxes, and other networked computing devices. PassPort takes complete packet captures of all test sessions and supports network capture from an IOT device outside of the test session. We combined this with the ability to send those captures directly to CloudShark, where the Threat Assessment tool can be applied to PassPort’s captures. Here, developers and QA testers can use the visualized Suricata alerts to notice bad or compromised behavior. Users with their own CloudShark Enterprise instance can add custom rules for use cases similar to those mentioned above in CDRouter security.
Looking towards the future
All in all, we’ve been really happy with the abilities that Suricata has given us for use in network device testing and network security analysis. We try to keep our custom rules updated as we learn new things, and keep the ET Open rules updated in CDRouter. We also look forward to finding new ways we can use this powerful tool!
Got some interesting ways you use network traffic analysis tools? Let us know!
