Whether you’re a vendor creating a VoIP analysis product for MSPs or an internal tools team at a broadband provider, you’ve likely hit a common wall: the need to correlate what happened in a call with what’s actually in the packets. When a support engineer or NOC operator is trying to resolve voice issues like call drops, one-way audio, or jitter, they need to be able to move fluidly between distinct but deeply connected views of the traffic.
Packet Viewer’s component-based architecture gives developers plug-and-play pieces of analysis UI that can drop into any application, tailored to customer needs. Here are a few ways these views can be combined for voice applications:
1. Analyzing the call flows
Who called whom? When did it start and end? Was the call completed or dropped mid-way? For a user-facing application, this is often the first step - giving someone a filtered, searchable list of what’s relevant before diving into the details.
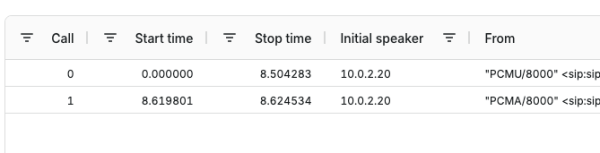
In Packet Viewer, the VoIP Calls Table is designed to answer these questions at a glance. It gives a clean summary of SIP-based calls, with key metadata like source/destination, packet count, call state, and timing.
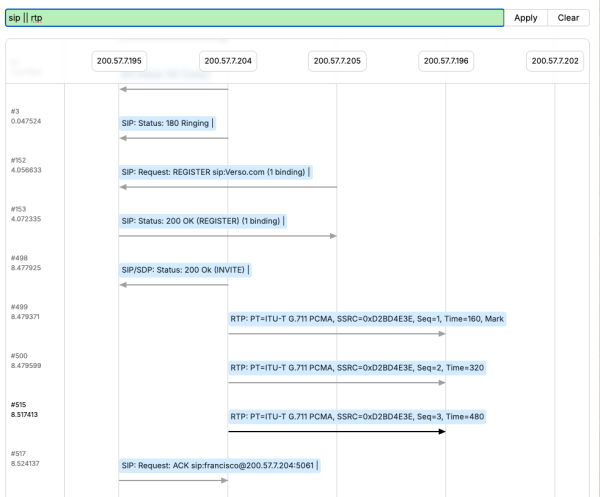
If users can then pivot to the Packet Sequence View, they can see the SIP protocol and RTP stream interactions that happened (or didn’t happen) in a given call, possibly due to misconfiguration, bad credentials, or dropped packets.
2. Listening to the real call experience
For call quality problems, a list of SIP messages and timestamps doesn’t tell you what the user heard. By reconstructing and playing back the RTP media stream, your tools can help teams confirm or disprove what the user experienced. Was there clipping? Silence? Delay? Loss? Can we hear the problem?
Especially for tier 2 and tier 3 support engineers, audio playback allows them to:
- Verify subjective complaints
- Measure packet loss and jitter
- Identify specific points of degradation
This is invaluable in support scenarios. It helps teams confirm whether a user’s reported audio issue is valid, subjective, or symptomatic of deeper problems in the network path.
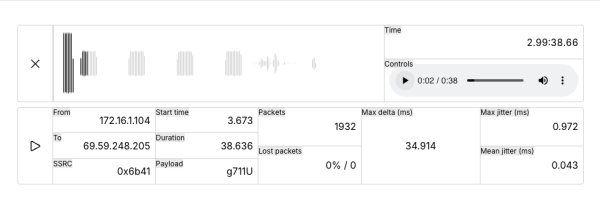
Packet Viewer’s RTP Stream Playback component extracts RTP audio streams, reconstructs them, and presents them directly in the browser for playback. You can visualize waveform, loss, jitter, and packet timing - all without leaving the application.
3. Pivoting to the packets
Of course, when a real issue is found (particularly one that’s intermittent or hard to reproduce) the only way to resolve it is by diving into the packets.
You need access to:
- SIP signaling transactions
- RTP stream headers
- Retransmissions, drops, or out-of-order delivery
Underlying transport behavior
The ability to connect directly to this data from the higher-level view is even better. Engineers should be able to click on a call or media stream and immediately see the associated traffic, which is filtered and ready for inspection. Without that connection, your tools force context-switching between systems, delaying the diagnosis and frustrating your team.
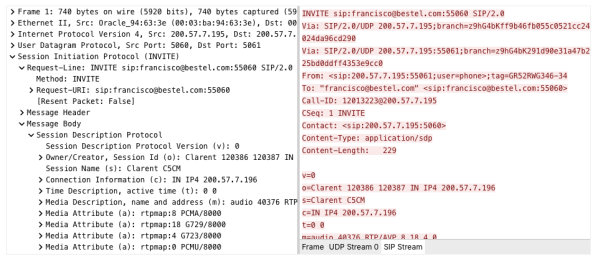
Packet Viewer’s PacketList and PacketTree components give deep visibility into individual packets, with modern UI interactions like filtering, click events, and text selection: all in the familiar Wireshark-like experience that exposes all of the same protocols.
Putting it all together with Packet Viewer components
Packet Viewer’s components are designed to work together in precisely this way. You can pivot between high-level overviews, user experience validation, and low-level forensic detail - all within the same user flow.
Whether you're building a dashboard for your NOC, a managed VoIP analytics platform, or a customer-facing support portal, you don’t want to bolt on packet capture as an afterthought. You want to integrate it in a way that feels native, fast, and informative. With Packet Viewer, your developers get the tools to create rich, interactive workflows around packet data.