Bandwidth Graphs that are
presentation worthy
Create detailed, informative and beautiful bandwidth graphs to explore network traffic. Browse, zoom, and view annotations all on a dynamic, interactive, graphing system that lets you configure what you need to see exactly what’s going on.

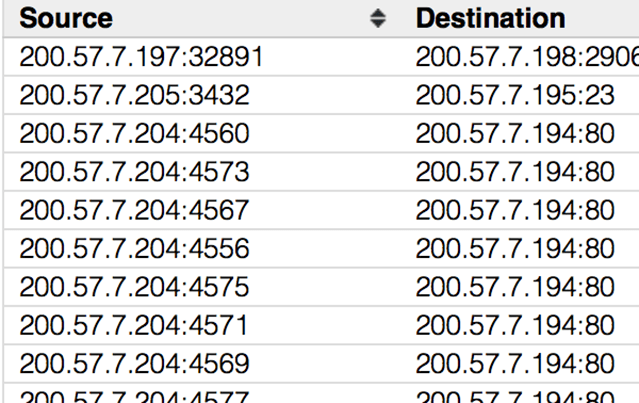
Conversations
Zero in on your top talkers, show client/server interactions, and discover unxpected sources of traffic. Conversations can be viewed at the MAC, IPv4/IPv6, or TCP/UDP application layer, and deliver the Follow Stream view for the chosen conversation with a single click.
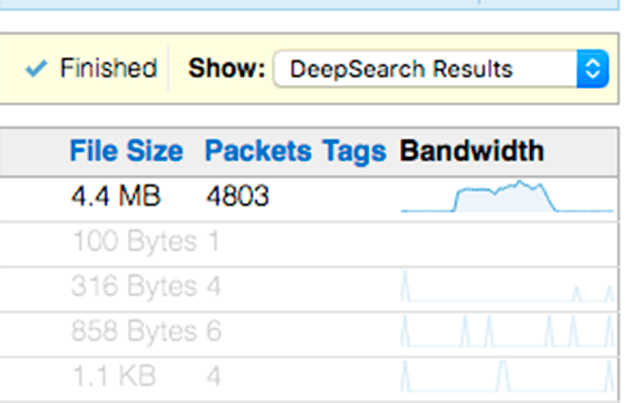
DeepSearch
Search for individual packets inside across multiple files in your capture archive. CloudShark uses standard display filters to help you narrow down exactly the traffic you are looking for.
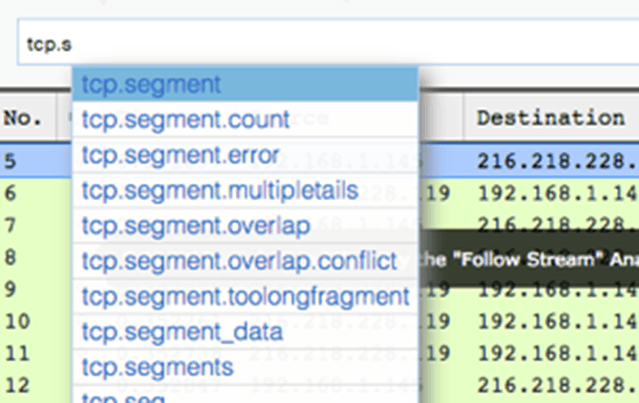
Display Filters
Support for all of the display filters found in WireShark and helps you remember what they are by autocompleting as you type. Any applied filter is automatically added to the URL for easy sharing.
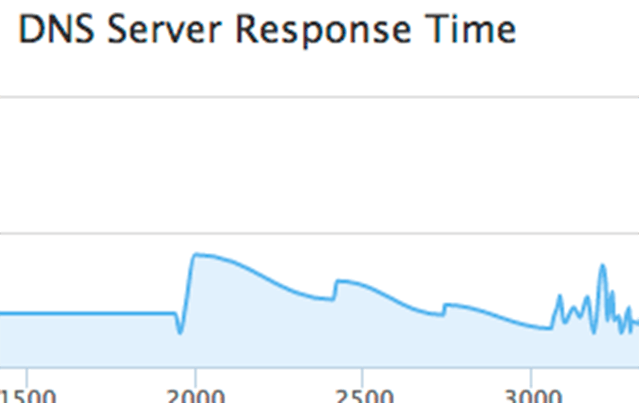
DNS Activity
Diagnose DNS errors, timeouts, and unexpected behavior from your capture files. CloudShark breaks down DNS queries, responses, timing information and error codes and give you the ability to drill down to the packets slowing down your network.
VOIP & SIP Analysis
CloudShark is the perfect tool for working with SIP conversations and VoIP call traffic. Use the built-in SIP Call Flow visual diagram for an easy to follow view of signaling between endpoints. Diagnose issues or confirm configurations by looking at the SIP headers, which are never more than a click away.

Follow Stream
View application layer conversations from TCP, UDP, and SSL streams. Link directly to the stream you’re looking at to make shared troubleshooting even easier.

HTTP Object Extraction
Reassemble and extract scripts, images, documents, and even videos from HTTP conversations within capture files. These documents can be previewed from inside of CloudShark, or downloaded for further offline analysis.
HTTP Requests
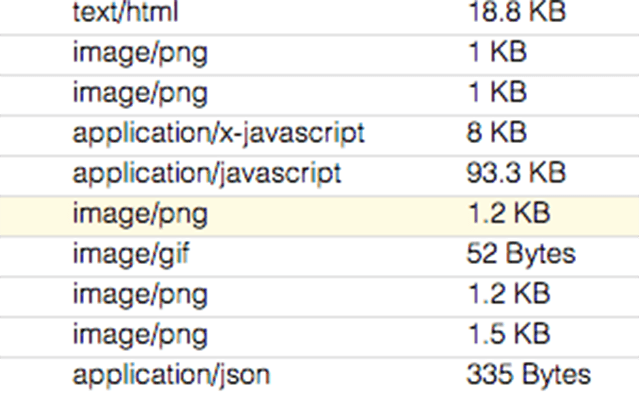
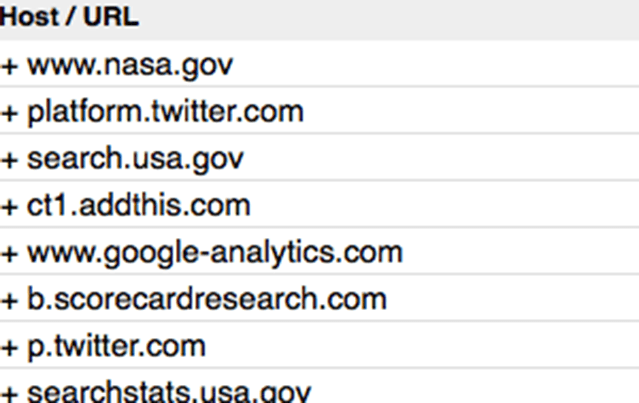
HTTP Request analysis can help track down problems in your web application traffic or discover which websites are offering up what traffic to your users. CloudShark’s HTTP Analysis tools let you drill down to the actual packets containing requests, and zoom out to see a high-level overview of response and error codes.
IP Geolocation
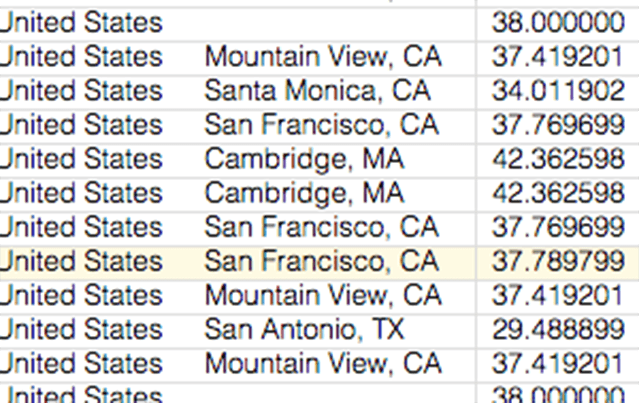
See the top-talkers in your capture. Sort by the total number of packets or bytes received or transmitted. CloudShark ships with the GeoLite database from MaxMind to provide GeoLocation services on public IP addresses and the ability to show you on a world map where traffic is coming from.
Merge and Extract
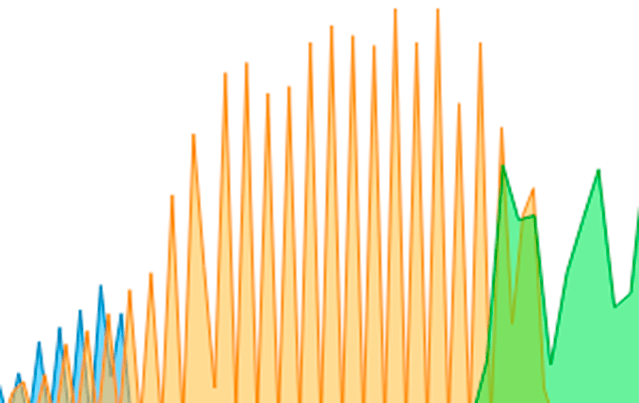
Merge captures together, or break them apart! Take capture files from multiple locations or over a set of time periods and CloudShark can merge them together. Or go the other way and drill down into a large file to save only the packets you need.
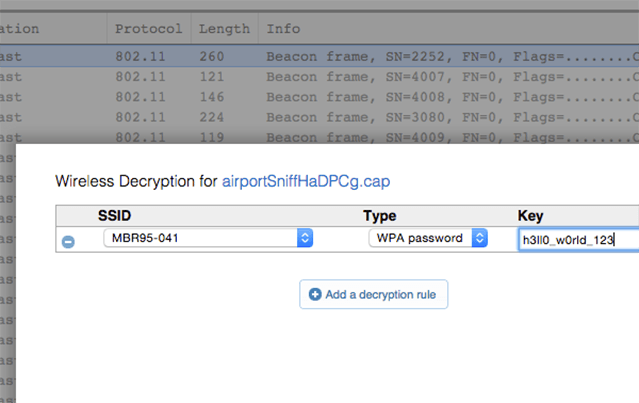
WiFi Decryption
Easily decrypt and debug 802.11 traffic when you know the WPA/WPA2 passphrase. CloudShark lets you enter known WPA decryption keys for captured 802.11 traffic to decrypt data, management, and group keys.
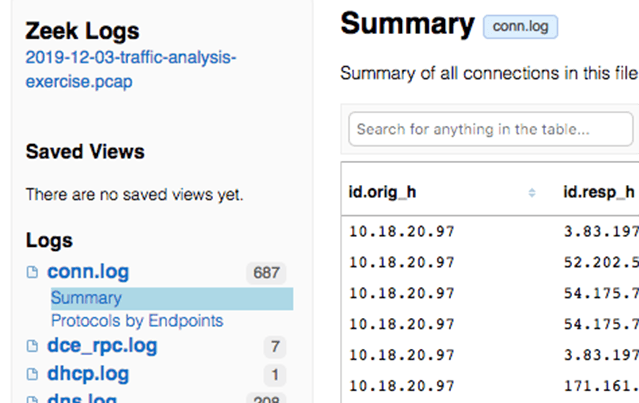
Zeek Logs
Generate and explore logs with the industry-standard Zeek tool. CloudShark installs and configures Zeek for you and provides helpful presets to make sense of all the data. Easily pivot back to the packets when you need a more in-depth analysis.
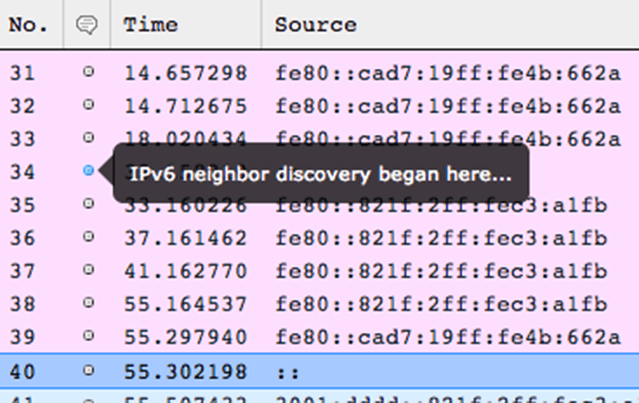
Packet Annotations
As you do analysis, save your thoughts and notes directly on the packets as you come across them. When you come back to the capture, the annotations will be there waiting.
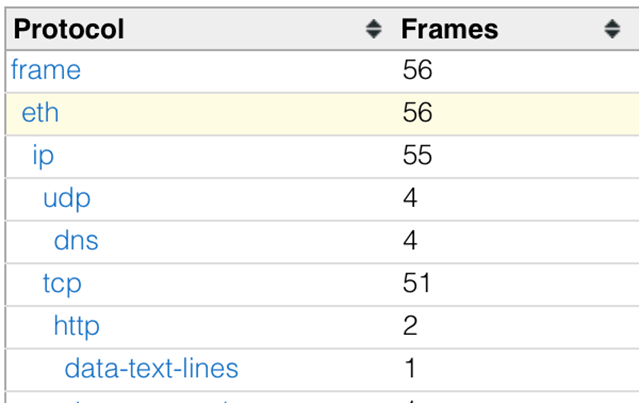
Protocol Hierarchy
Quickly get an answer to what kind of traffic your capture file contains or if one application is taking the majority of the bandwidth. This is often the first step when diagnosing problems within a network. Go from this view to filtering specific protocols with a single click.
Protocol Ladders
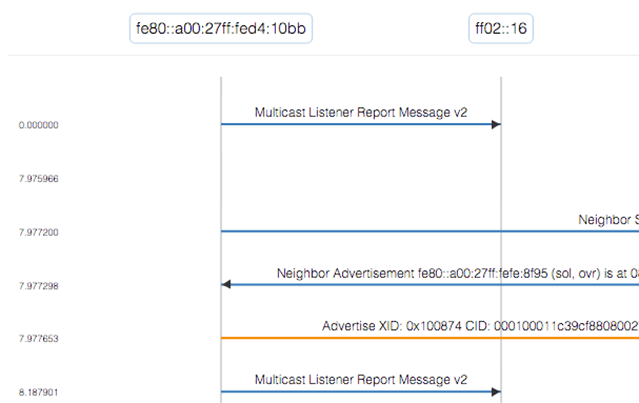
Trace protocols and conversations in a graphical representation of your capture files. Apply display filters, sort and hide nodes to get exactly the view that helps you.
RTP Playback
Playback RTP audio from captured traffic without leaving your web browser. CloudShark is able to decode G.711, G.722, G.729, and GSM audio. Listen to VoIP calls to diagnose quality issues and drop-outs. Share audio with others without sending large files.

SSL Descryption
Decrypt SSL streams with either the RSA private key, or the CLIENT_KEYLOG! View encrypted HTTPS or HTTP2 conversations, read TLS data, and debug application traffic.

Wireless Networks
Discover rogue access points, check for signal coverage, and analyze your BYOD deployment by analyzing raw wireless capture data. Inspect the easy-to-read list of SSID’s, vendor information, signal-strength, and security profile information from WiFi Beacons and Probe responses in your capture.


Ready to chat?
You can spend hours researching what you need, or minutes discussing it with an expert. We would love to help understand your needs and if we can help. Click below to contact one of our team members.
Let's chat